How to Read Weather Charts for Hiking, Cycling and Off-Road Trips (and Decide Go or No-Go)
Learn to read meteograms and pressure charts, use TrailX's weather check along your route, and turn a forecast into a go, no-go or turn-around decision.
On this page
A forecast isn't a promise. It's a set of numbers with uncertainty attached, and on a trail the cost of reading it wrong is much higher than on a city street. A light shower at sea level can be a snowstorm on a pass; a breeze in the valley can be a gale on a ridge.
This guide shows you how to read the charts that matter, how to use the weather tools on every TrailX trail, and, most importantly, how to turn all of it into a decision: go, wait, change the plan, or turn around.
The five numbers that matter on a trail
Weather apps lead with an icon and a temperature. For a trail you need more than that, and you need it for the height and time you'll actually be somewhere.
- Temperature at your altitude. Air cools by roughly 6.5 °C for every 1,000 m you climb. A pleasant 20 °C in the valley can mean about 7 °C at a pass 2,000 m higher, before wind.
- Wind, and especially gusts. Average wind tells you how cold it will feel; gusts tell you whether you can stand up on a ridge or keep a motorbike in its lane. Wind also makes cold far worse: −10 °C with a 30 km/h wind feels like about −20 °C.
- Precipitation: amount and probability. "70%" is the chance that measurable rain or snow falls at all, not how much. Always read the millimetres alongside it: 70% of 0.2 mm is a passing shower; 40% of 25 mm is a storm you don't want to be in.
- Freezing level. The height at which the air drops below 0 °C. If it's below the highest point of your route and precipitation is forecast, expect snow, slush or ice up there, even when the valley forecast says rain.
- Thunderstorm potential. Mountain storms usually build in the afternoon as the ground heats up. Forecasts show this as "thunderstorm" icons, lightning symbols or a number called CAPE (convective energy): the higher it is, the more fuel storms have.
Two more to keep an eye on: UV, which rises by roughly 10% for every 1,000 m of altitude, and cloud base and visibility, which decide whether you'll see the route, the drop-offs and the oncoming truck.
How to read a meteogram
A meteogram is the single most useful weather chart for a trip: the forecast for one place, laid out hour by hour. Here's a real one, for the top of Khardung La at 5,359 m, from the forecast published on 14 October 2026.
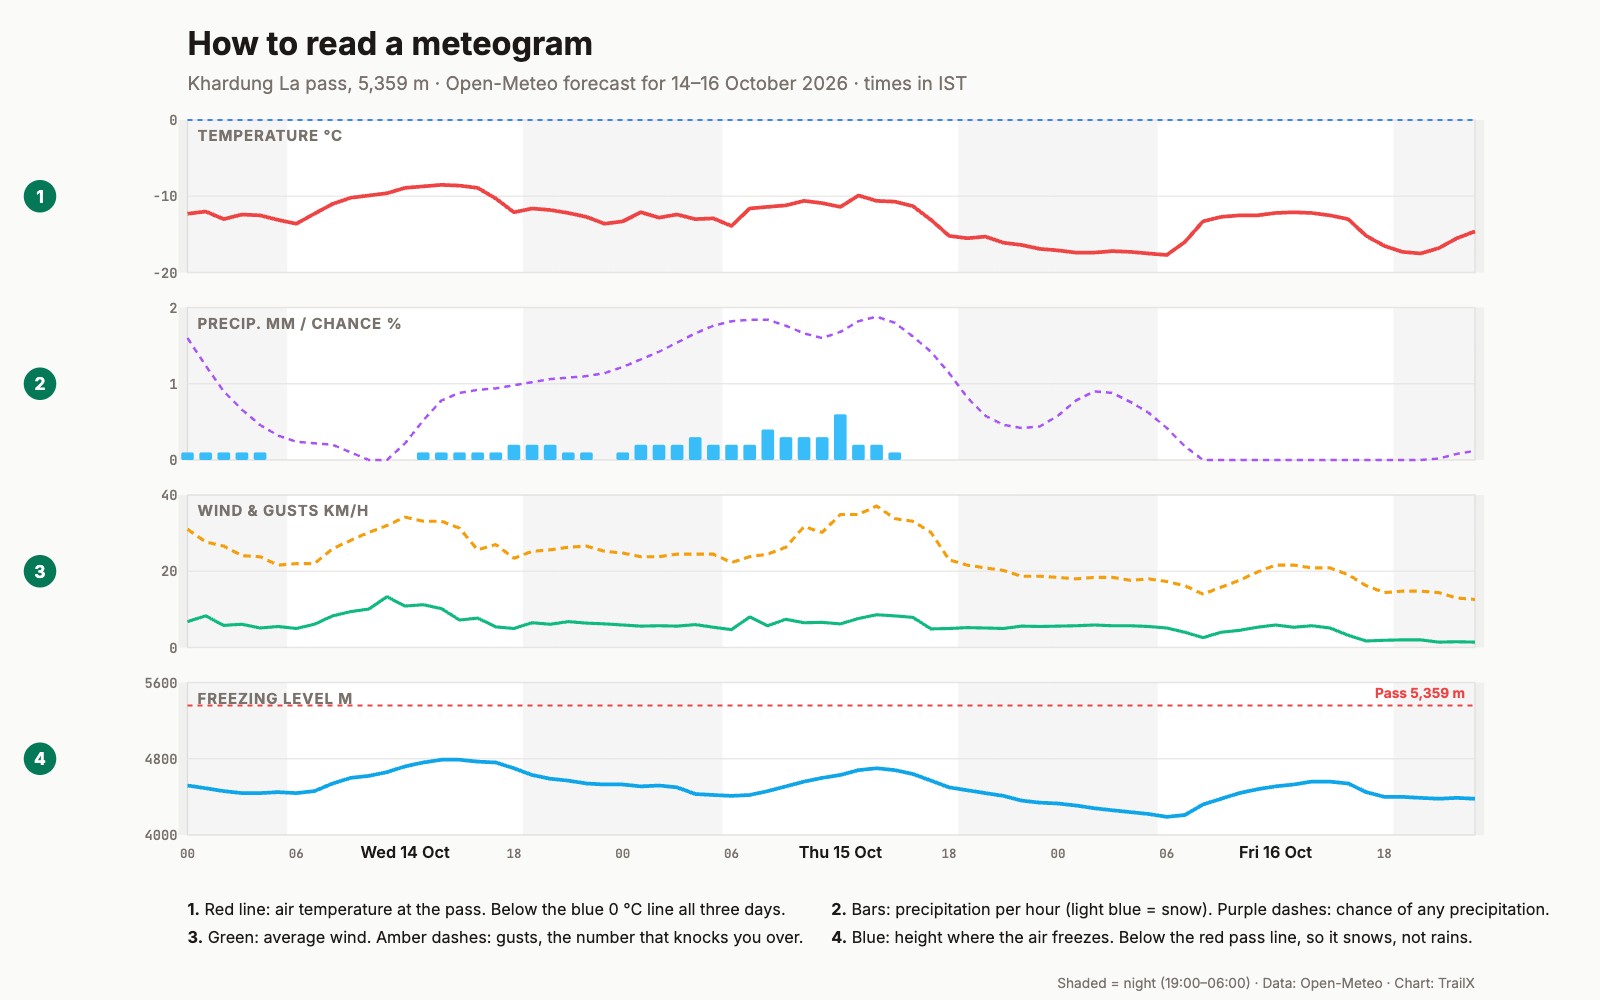 A meteogram for Khardung La with four panels: temperature, precipitation and its probability, wind and gusts, and freezing level against the height of the pass
Read it top to bottom, then across:
- Temperature (red). It never comes near the dashed 0 °C line: between about −18 °C and −8 °C for three days, coldest before dawn.
- Precipitation (bars) and probability (purple dashes). Light snow on and off through Wednesday and Thursday morning, about 4 cm in total, with the chance peaking above 90% on Thursday. By Friday the probability drops to zero.
- Wind (green) and gusts (amber dashes). Average wind stays under 15 km/h, but gusts reach the high 30s on Wednesday and Thursday afternoons.
- Freezing level (blue) against the pass (red dashes). The freezing level sits between about 4,200 and 4,800 m, well below the pass, so everything that falls up there is snow.
The decision this chart supports: Wednesday and Thursday mean snow on the road surface at the top, cold that punishes a breakdown, and gusty afternoons. Friday is the clear, calm window, though bitterly cold early. If you have the flexibility, cross on Friday, mid-morning once the sun is on the road, carry warm layers for everyone in the vehicle, and check that the pass is open before setting out.
That's the whole method: find the window, then check every number inside it.
How to read a surface pressure chart
Meteograms tell you what will happen at one place. Pressure charts (synoptic charts) tell you why, and how the whole region is changing.
- Isobars are lines joining places of equal air pressure. The closer together they are, the stronger the wind.
- H (high pressure) usually means settled, dry weather. L (low pressure) means rising air, cloud, rain and wind. In the northern hemisphere wind circles anticlockwise around a low.
- Fronts are boundaries between air masses. A cold front (blue line with triangles) brings a sharp band of heavy rain or snow, gusts and a drop in temperature. A warm front (red line with semicircles) brings a longer spell of steady rain and low cloud. An occluded front (purple, both symbols) is a mixture of the two.
In South Asia, two patterns matter most:
- Western disturbances: low-pressure systems arriving from the west in winter and spring, bringing snow to the Himalaya and rain to the plains of north India. They're why high passes like Zoji La, Sach Pass and Shinku La can close at short notice.
- The monsoon (June to September): a season-long pattern rather than a single system. On the charts it shows as moist south-westerly winds and a "monsoon trough". On the ground it means heavy rain on the Western Ghats and Himalayan foothills, and landslides on roads like the Adi Kailash road.
Weather on TrailX
Every TrailX trail page has weather built in, so you can check the forecast for the route itself rather than the nearest town.
Weather check: slide along the route
On each trail page, the Weather check panel (beside the route details) has a slider that runs from the start of the trail to the end. Drag it and TrailX fetches the live forecast for that exact point on the route, showing its elevation as you go. For each point you get:
- the current temperature, with today's low and high;
- the current conditions (clear, cloudy, fog, drizzle, rain, snow or thunderstorm);
- any precipitation (mm) or snowfall (cm) happening now;
- today's maximum UV index.
This is what makes it useful on long routes: on a road like Pipariya to Pachmarhi or the Serra da Leba pass, the weather at the bottom and the top can be completely different. Slide to the highest point, not just the start.
The risk banner
Above the numbers, TrailX combines the forecast with the trail's own terrain into a risk banner: low, moderate, high or extreme. It looks at the coming week, not just today, and uses rules like these:
| What TrailX sees | What it tells you |
|---|---|
| A route above 2,500 m with snowfall in the forecast, or freezing nights in winter (December to March) | High: snow blockage or frozen passes likely |
| A route above 2,500 m with freezing nights, or in winter | Moderate: possible black ice or old snow |
| Extreme cold: below −10 °C now, or nights below −15 °C | High: frozen tracks and a real risk of vehicle failure |
| Steep terrain with heavy rain (over 5 mm an hour now, or over 20 mm on any day this week) | High: landslide danger |
| Heavy rain, or steep terrain during the monsoon (June to September) | Moderate: check for washouts |
| Wind over 60 km/h | Extreme: severe weather, falling debris |
A green banner isn't a guarantee, and a red one isn't a ban; they're prompts to look closer. A moderate on the Kankeshwar Temple Trek in July means wet, slippery steps. A high on Umling La in December means the road may be shut.
Check Conditions
The Check Conditions button on a trail page (free account needed) gives you a written summary for the trail's location: a short outlook for the coming days, the likely road or path condition, a gear list for those conditions, and recent news or updates about the area. Use it for the "anything I should know?" question, like closures, festivals or recent landslides, that a forecast can't answer.
Weather on your own route
Planning your own route in the route planner? It has the same slider: once your route is drawn, slide along it to see the forecast and risk at any point. You can also drop any GPX into the GPX analyzer to check its elevation profile and gradient first, then read the weather at its high points.
From chart to decision
Reading charts is the easy part. Here's how to turn them into a decision you'll stick to.
1. Watch the trend, not one forecast
Start checking 3–5 days out and note how the forecast changes. A storm that keeps arriving earlier, or a dry window that keeps shrinking, is telling you something. Forecasts more than a week ahead are only useful as a trend.
2. Compare at least two sources
Different weather models (ECMWF, GFS, ICON and others) often disagree in the mountains. If they agree, trust the forecast more. If they don't, plan for the worse one. Sites like Windy and Meteoblue (below) let you compare models side by side.
3. Find your critical window
Work out when you'll be at the highest, most exposed or most remote point of the route: the summit, the pass, the river crossing, the stretch with no escape. Use the elevation profile and your pace to estimate it, then check the forecast for that hour, at that height.
4. Use thresholds you set in advance
Decide your limits at home, not on the mountain. These are common rules of thumb, not hard limits: adjust them for your experience, group and vehicle.
| Hazard | Hiking | Cycling | Off-road and mountain driving |
|---|---|---|---|
| Thunderstorms forecast | Be off summits and ridges by early afternoon | Avoid exposed climbs in the afternoon | Avoid high passes and open ridges in the afternoon |
| Gusts over about 50 km/h | Avoid narrow ridges and exposed edges | Descents and crosswinds get dangerous | Care on cliff roads, high-sided vehicles, roof loads |
| More than about 20 mm of rain in a day | Streams rise, steep paths turn slippery | Wet descents, poor visibility | Landslides and washouts on steep or unpaved roads |
| Freezing level below your route's high point, with precipitation | Snow or ice up high: microspikes, warm layers | Ice on descents: postpone | Snow on the pass: chains, low gear, or wait |
| Wind chill below about −10 °C | Full winter layers, protect hands and face | Not a cycling day for most people | Plan for a breakdown in the cold: warm kit for everyone |
5. Set a turnaround time and a Plan B
Before you start, agree the time by which you'll turn back if you're not past the crux, and what you'll do instead: a lower trail, a shorter loop, a rest day. Then keep to it. Most mountain accidents in bad weather happen to people who saw it coming and kept going.
6. Re-check on the day, and on the trail
Check again the evening before and the morning you leave. On the trail, trust what you see: building towers of cloud, a sudden drop in temperature, thunder (if you can hear it, you're within reach of lightning), or rising streams. When the sky and the forecast disagree, believe the sky.
Weather charts beyond TrailX
TrailX shows you the forecast along your route. For deeper planning, these are the tools worth knowing:
| Tool | Best for |
|---|---|
| Windy | Animated maps of wind, rain, snow, clouds, CAPE and more, with ECMWF, GFS and ICON models side by side, plus meteograms for any point |
| Meteoblue | Detailed meteograms, multi-model comparisons and forecast uncertainty for any location |
| Yr | Clean hour-by-hour forecasts worldwide from the Norwegian Meteorological Institute |
| Mountain-Forecast | Forecasts for named peaks at summit, mid and base heights, including freezing level |
| India Meteorological Department | Official forecasts and colour-coded district warnings across India, plus radar and nowcasts |
| ECMWF charts | Open charts from the European model, including pressure and precipitation maps |
| Met Office | Surface pressure charts with fronts (for Europe and the North Atlantic) |
| MWIS | Mountain weather written for walkers and climbers in the UK's mountains |
| US National Weather Service | Official US forecasts, hourly weather graphs and forecasters' discussions |
| RainViewer | Live rain radar, to see showers coming in real time |
| LightningMaps | Live lightning strikes from the Blitzortung community network |
| EAWS and avalanche.org | Avalanche bulletins for Europe and the United States |
| Open-Meteo | Free, open weather data and the forecasts behind TrailX's weather check |
In India, avalanche warnings for Jammu and Kashmir, Ladakh, Himachal Pradesh and Uttarakhand come from the Defence Geoinformatics Research Establishment (DGRE) and are usually reported in local news; always check them before winter trips to the high passes.
Common mistakes
- Reading the forecast for the town, not the trail. Most forecasts are for a grid cell's average height, often the valley. Use a point on the route (TrailX's slider) or a height-specific forecast.
- Trusting the icon. A sun icon with 60 km/h gusts is not a nice day on a ridge.
- Confusing probability with amount. Read both.
- Ignoring the freezing level. Rain in the forecast can be snow on your pass.
- Checking once. Mountain forecasts change daily, sometimes hourly.
- Not deciding in advance. Set thresholds and a turnaround time before you leave, when you're thinking clearly.
Your weather checklist
- Checked the forecast at the route's highest and most exposed point, at the time you'll be there
- Compared at least two sources or models
- Read temperature, gusts, precipitation amount and freezing level, not just the icon
- Checked official warnings, road and pass status, and avalanche bulletins where relevant
- Set a turnaround time and a Plan B
- Packed for the worst case in the forecast, not the average
- Downloaded the route for offline navigation, in case the weather takes away your signal
Find a trail and check its weather
Pick a route and slide along its weather:
- Off-road and 4x4 trails near you
- Hiking trails near you
- Cycling routes near you
- Scenic drives near you
Sources
- World Health Organization on UV radiation and altitude; Environment and Climate Change Canada's wind chill index.
- US National Weather Service on lightning safety and the meaning of probability of precipitation.
- India Meteorological Department on western disturbances and the monsoon.
- Forecast data for the Khardung La example from Open-Meteo, retrieved 14 October 2026.
Where to next?

Written by
TrailX
Hikers, riders and drivers mapping the world's trails, and sharing what we learn along the way.
Responses