How to Use a Topographic Map for Route Planning
Topographic map route planning made simple: read contour lines, work out gradient from spacing, spot hazards and bail-outs, then plan the route in TrailX.
On this page
A route line on a map tells you where a trail goes. A topographic map tells you what it will feel like: where the climb bites, where the ground drops away, where water collects and where you can escape if the weather turns. Good topographic map route planning is mostly about reading those brown squiggly lines well enough to picture the land before you stand on it.
It sounds technical, but it comes down to a handful of patterns. Once you've seen them, you start spotting them everywhere. Here's how we read a topo map, how we turn that into a plan, and how to do the same thing on screen in TrailX.
Contour lines in plain language
A contour line joins points of equal height. Walk along one and you'd never go up or down. Stack them together and you get a picture of the shape of the land, drawn from above.
Three things to check before anything else:
- The contour interval. This is the height difference between neighbouring lines, printed in the map legend. It's commonly 10 or 20 metres on hiking maps, and maps from some countries use feet. Everything else depends on it, so look it up first.
- Index contours. Every fifth line is usually drawn thicker and labelled with its height. Use those to count quickly instead of tallying every thin line.
- The scale. A 1:25,000 map means 1 cm on paper is 250 m on the ground. You need this to turn spacing into steepness.
Reading the shape of the land
Once you know the interval, the spacing and shape of the lines do the talking.
| What you see on the map | What it means on the ground |
|---|---|
| Lines far apart | Gentle slope or flat ground |
| Lines close together | Steep slope |
| Lines merging or touching | Cliff or near-vertical drop |
| V shapes pointing uphill | Valley, gully or stream line |
| V or U shapes pointing downhill | Spur or ridge running down from higher ground |
| Two sets of closed rings with a low gap between | Saddle (col, pass) |
| Small closed rings | Summit or knoll |
| Wide blank space between lines | Plateau, valley floor or broad flat top |
The V rule is the one people mix up most. In a valley, the contours bend upstream, so the point of the V aims at higher ground. On a spur, they bend the other way and the point aims downhill. If there's a blue stream line running through the V, you're definitely looking at a valley.
Saddles are worth hunting for. They're the natural low point between two summits, and they're where most passes and many trails cross a ridge. Garnet Canyon to the Lower Saddle in Grand Teton National Park even has one in its name: 21.2 km and 1,147 m of ascent, rated Hard. Open it on the topo layer and you can trace how the route follows a valley up towards the low point between higher ground.
Estimating gradient from contour spacing
You don't need a calculator on the trail, but doing the sum once at home builds an instinct that sticks. Gradient is simply height gained divided by distance travelled.
Here's a worked example on a 1:25,000 map with a 10 m contour interval:
- Pick two points on your route. Count the gaps between contour lines you cross going uphill. Say there are 4 gaps, so the rise is 4 × 10 m = 40 m.
- Measure the distance between the points on the map. Say it's 8 mm. At 1:25,000, 1 mm is 25 m, so 8 mm is 200 m on the ground.
- Divide rise by distance: 40 ÷ 200 = 0.2, or a 20 % gradient (roughly 11°). That's a proper uphill grind, but very walkable.
- Now imagine the same 4 gaps squeezed into 2 mm. That's 40 m of rise over 50 m: an 80 % gradient (about 39°). That's scrambling territory, and on loose ground it's somewhere we'd look for another line.
A handy shortcut for that map: contours 1 mm apart mean about 40 % (10 m over 25 m). Wider than that is getting easier; tighter is getting serious.
Remember that map distance is horizontal. On steep slopes the distance you actually walk is a little longer, but for planning purposes the horizontal figure is fine.
Count the gaps, measure the spacing, divide. Do it a few times at home and you'll start feeling steepness just by glancing at the map.
For context, TrailX's gradient breakdown on uploaded routes treats 0 to 3 % as flat, 3 to 8 % as moderate and anything above 8 % as steep. Our example's 20 % is well into steep, and the 80 % pitch is in a different league.
Spotting hazards and bail-outs
This is where topographic map route planning earns its keep. Before a big day, we scan the map for a few specific things.
Hazards to look for:
- Merged contours next to the path. A trail can run safely along a cliff edge in good weather and feel very different in wind or mist.
- Tight contours on a descent. Steep downhill is where slips happen, and it takes longer than people expect.
- Narrow V-shaped valleys. Gullies funnel water in heavy rain and can hold snow late into the season.
- Long stretches above the last bail-out. If the route climbs a narrow ridge for a long way with steep ground on both sides, there's no easy way off.
Bail-outs to note:
- Spurs with evenly spaced contours leading down to a path or road.
- Saddles where a side valley drops away more gently than the main route.
- Huts, roads and villages marked on the map, and the time it would take to reach each one.
Kinja Ridge Climb in Nepal is a good one to study. It packs 1,621 m of ascent into 9.1 km and is rated Hard, so expect tightly bunched contours for much of the way. Looking at where the ground eases either side of the line tells you more about your options than the route line alone. Our safety guidelines cover the rest of the planning, from telling someone your route to setting a turnaround time.
Turning the map into a route
With the land read, building the plan is straightforward:
- Trace the line from start to finish, noting where it crosses contours steeply and where it runs along them.
- Split it into legs at obvious features: a saddle, a stream junction, a summit, a hut.
- Estimate each leg using distance plus climb, then add generous margins for steep descents.
- Mark your bail-outs and decide in advance which one you'd take, and when.
- Set a turnaround time at the leg that commits you to the high ground.
Moel Hebog from Beddgelert in Wales makes a tidy practice run: 16.5 km with 992 m of ascent, rated Hard. Try picking out where it climbs hardest from the contour spacing, then check yourself against the elevation profile. If you want to go deeper on the profile side, we walk through it in how to read an elevation profile.
Doing it digitally in TrailX
Paper teaches the skill, but a screen makes it quick to explore options. Every trail page on TrailX has a map with a base layer switcher. Choose the Outdoors topographic map to see contour lines under the route (OpenTopoMap is there too), then turn on 3D terrain to see the same slopes as actual relief. Hovering the elevation profile alongside the map is a fast way to match a steep section on the chart with tight contours on the ground.
Try it on Gössler Alm Hike in Styria, Austria: 6.5 km with 1,205 m of ascent and rated Hard. That's a lot of height for the distance, and the contours make it obvious where it comes from. For contrast, open Penobscot Mountain and Jordan Pond Loop in Maine, 12.2 km with 368 m of climbing and rated Moderate, and compare how much more relaxed the spacing looks.
To plan your own line, open the Route Composer. Pick a profile (Hiking, Cycling, On-Road or Off-Road), click the map to add stops and switch the base map to the topographic layer. The terrain relief (hillshade) toggle shades slopes as if lit from one side, which makes valleys, spurs and saddles jump out even before you read a single contour. Turn on 3D terrain to check a ridge or descent, and use the elevation profile to see what your line actually climbs. You can compare two options side by side (A vs B), which is perfect for weighing a direct climb against a longer, gentler spur. When you're happy, export it as GPX. Our hiking route planner guide covers the composer step by step, and create a GPX route explains what's in the file.
The same terrain reading applies to vehicles, with different limits. If you're planning a 4x4 or overland trip, off-road terrain analysis goes into slopes and surfaces from behind the wheel.
Taking the topo map with you
The free TrailX app uses the same Outdoors topographic map with contours and hillshade, plus 3D terrain and an animated 3D flyover of a trail. Before you lose signal, download the regional map and the trail so the contours are there offline. That matters most on routes like Gosaikunda Lake Trek in Rasuwa, Nepal (9.5 km, 1,110 m of ascent, Hard) or Thorong La Pass Crossing in Manang (65.7 km, 3,014 m of ascent, Extreme), a classic saddle crossing. If Nepal is on your list, start with our first trek in Nepal guide and browse hiking in Nepal.
Why a paper map still matters
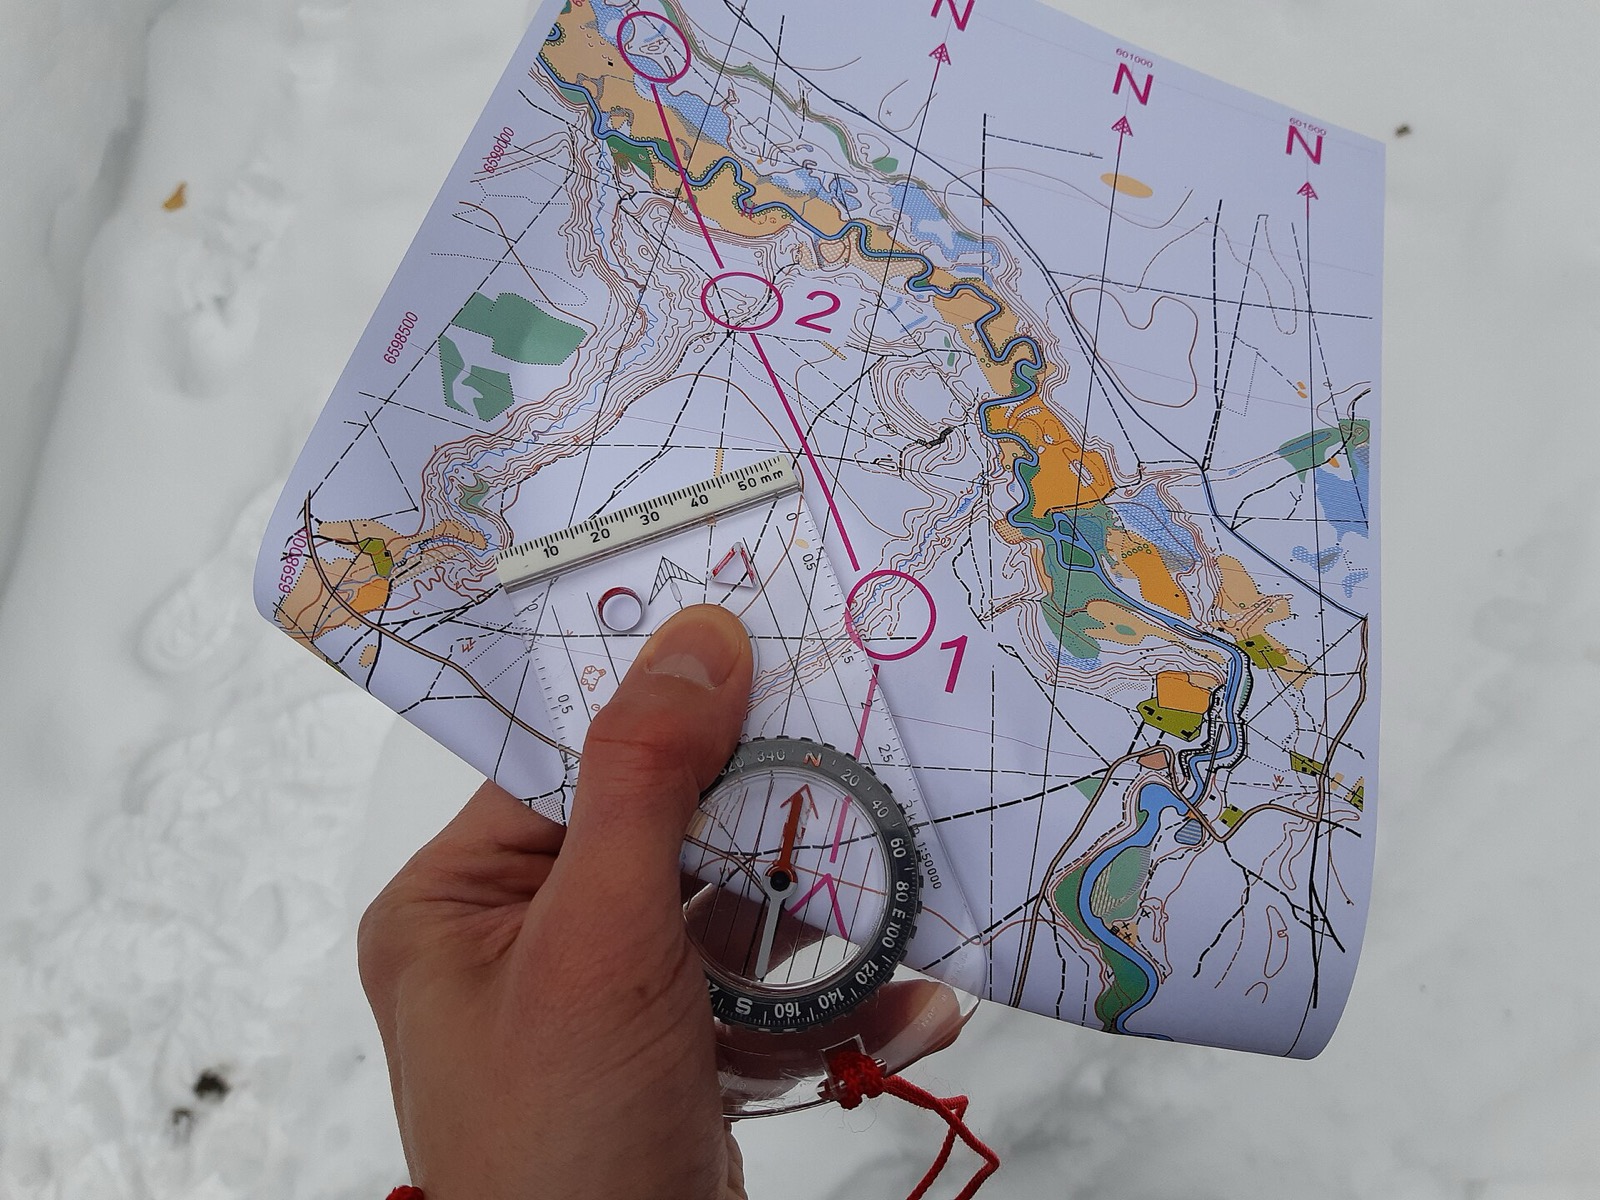
We love a phone map, but we still carry paper on big days. A printed topo map has no battery, works in the rain in a map case, and shows a wide area at once, which makes it easier to spot that gentle spur two valleys over. Pair it with a compass and the skills above work anywhere, with or without signal.
Practise at home with both side by side: read a section on paper, predict what it looks like, then check it on the 3D terrain view. It's the fastest way we know to make contour lines feel like real hills. If you'd like a deeper reference on how contours are drawn, the contour line article on Wikipedia is a solid starting point.
Where to next?
- Plan a line on the map: open the Route Composer and switch on terrain relief.
- Read the climb in detail: how to read an elevation profile.
- Practise on a classic: study Moel Hebog from Beddgelert, then explore hiking in the United Kingdom.
- Take the map offline: get the free TrailX app.
- Before you go: run through our safety guidelines.

Written by
TrailX
Hikers, riders and drivers mapping the world's trails, and sharing what we learn along the way.
Responses